Saturday 2 June 2012

SOCIOLOGY-1


1. Sociology - The Discipline:

(a) Modernity and social changes in Europe
and emergence of sociology.
    Social thought is as old as society itself, yet the origin of sociology is traced back to 19th century Western Europe. Sometimes Sociology is called the child of the ‘age of revolution’. The revolutionary changes in the preceding three centuries had decisively changed the way people lived thereby paving the way for the emergence of Sociology as we have today. Sociology took birth in such a climate of social upheaval. The roots of the ideas developed by the early sociologists lie in the then social conditions that prevailed in Europe.
The modern era in Europe and the conditions of modernity were brought about by three major processes. They are:
  1. The Enlightenment- dawning of the ‘age of reason’.
  2. The French Revolution-the quest for political sovereignty.
  3. The Industrial Revolution-the system of mass manufacture.        
These revolutions completely transformed not only European society but also the rest of the world as it came into contact with Europe. The revolutions initiated a process of thinking about society particularly the consequences of revolutionary happenings. Industrial Revolution accelerated the process of urbanization. Urbanization, in its turn, created many social problems. French Revolution led to rethinking about the form of government and practice of democracy. Thus changes were all around in economy, polity and social spheres of living. The industrialization, urbanization and capitalism and the attendant consequences began transforming the societies of Europe.

The Enlightenment

It refers to that period in European history (late 17th and 18th centuries) which put human being at the centre of the universe and rational thought as the central feature of the human being. The ability to think rationally and critically transformed the individual human being into both the producer and user of all knowledge. For reason to become the defining feature, it was necessary to displace nature, religion and divine acts from the central position they earlier occupied. Thus the attitudes of mind that we refer today as secular, scientific, progress and humanistic developed.
During this period a belief developed that both nature and society can be studied scientifically.

The French Revolution

The French Revolution which erupted in 1789 marked a turning point in the history of human struggle for freedom and equality. It changed the political structure of European society. It put an end to the age of feudalism and ushered in a new order of society. It replaced the age of feudalism by heralding the arrival of democracy.
The Revolution announced the arrival of political sovereignty at the level of individuals as well as nation-states. It signaled the emancipation of individuals from the oppressive rule of the religious and feudal institutions that dominated French before the Revolution. The nation-state itself was redefined as a sovereign entity with a centralized government. The ideals of the French Revolution- liberty, equality and fraternity- became the watchwords of modern state.
This Revolution brought about far reaching changes in not only French society but also in societies throughout Europe. Even societies in other continents were influenced by ideas generated during the Revolution. There were many significant themes which arose due to the impact of this Revolution which have been the focus of interest of the early sociologists. These significant themes include the transformation of property, new social class etc.

The Industrial Revolution

The foundation of modern industry was laid by the Industrial Revolution, which began in England in the late 18th and early 19th centuries. It brought about great changes in the social and economic life of the people first in England, then in other countries of Europe and later in other continents.
It had two important aspects:
1. Systematic application of science and technology to industrial production, particularly invention of new machines and harnessing of new sources of power. These facilitated the production process and give rise to the factory system and mass manufacture of goods.
2. Evolved new ways of organizing labour and markets on a scale larger than anything in the past. The goods were produced on a gigantic scale for distant markets across the world. The raw materials used in their production were also obtained from all over the world.
Industrialization threw into turmoil societies that have been relatively stable for centuries. New industries and technologies changed the face of social and physical environment. Peasants left rural areas and flocked to the towns, where they worked under appalling conditions. Cities grew at an unprecedented rate. Social problems become rampant in the teeming cities. The direction of change was unclear and the stability of social order seemed threatened.
The significant themes of this Revolution which concerned the early sociologists were the condition of labour, transformation of property, industrial city/ urbanism and technology and the factory system.
Against such background, some thinkers of that time were concerned about building their society anew. Those who dealt with these problems are considered as the founding fathers of Sociology because they were seriously concerned with these problems in a systematic way. Most notable among the thinkers have been Auguste Comte, Herbert Spencer, Emile Durkheim, Karl Marx and Max Weber. All these pioneers came from different disciplines.
Auguste Comte (1798-1857), who is also known as, the ‘father of sociology’, argued that the methods used in physics should be used for the study of society. Such a study would reveal the laws of evolution and the laws of the functioning of society. Once this knowledge was available, we would be able to build society. Auguste Comte, who gave sociology its name, identified three stages of human society: Theological (various phenomena were explained in religious terms), Metaphysical (explanations were philosophical) and Positivism (phenomena were explained in terms of the scientific approach to the social world).
The idea of evolution was carried forward in the works of the British sociologist,
Herbert Spencer (1820-1903). He argued for the universality of the principle of evolution. His view of the evolution of societies is known as Social Darwinism.
The credit for developing sociology as an independent discipline and science goes to Emile Durkheim (1858-1917), a French sociologist. Durkheim said that sociologists study ’social facts’, which are objective and exist in the consciousness of the collectivity. Thus, social fact is exterior to human mind and but it constraints on human behaviour. Hence, social facts do not have their origin in the individual. Further, they should be explained by other social facts, rather than in terms of biological, psychological, environmental, or geographical acts.
In Germany, the most influential work was of Max Weber (1864-1920). In comparison to Durkheim, Weber said that the sociologist studies ’social action’, which is an act an individual performs and assigns meaning. The task of sociologists is to understand the subjectivemeaning of an act.
German social thinker Karl Marx’s ideas (1818-1883) were influential in Sociology. He argued that every society was divided into two classes, viz. ‘Haves’ and ‘Have-nots”. He believed that conflict was initiator of change in history. He, therefore, gave central importance to class and class-conflict.
Thus the development of Sociology in France (Comte, Durkheim), Germany (Marx, Weber) and England (Spencer) have been outlined as in above. Their contributions have profound influence in Sociology everywhere in the world.
Sociology thus flowered in precisely those societies that had experienced the most pronounced or greatest social changes. France, Germany and England underwent a truly revolutionary social transformation; and in all these countries, the study of Sociology had emerged by the end of the 19th century.


(b) Scope of the subject and comparison
with other social sciences.

(c) Sociology and common sense.

Monday 14 May 2012

CSAT- MENSURATION


MENSURATION FORMULA


CSAT - GRAPHS


1.Proportional values. If variables  y   and   are direct proportional, then the functionaldependence between them is represented by the equation:


y  = kx ,

where  k  is a constant a factor of proportionality.
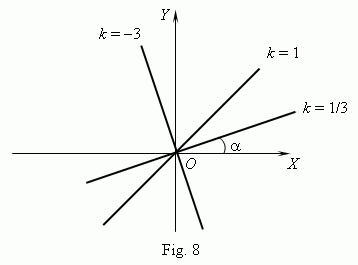
A graph of a direct proportionality is a straight line, going through an origin of coordinatesand forming with an x-axis an angle , a tangent of which is equal to k :  tan  = k ( Fig.8 ). Therefore, a factor of proportionality is called also a slope. There are shown three graphswith  k = 1/3,  k = 1 and k = – 3 on Fig.8.


2.Linear function. If variables  y  and   are tied by the 1-st degree equation:


A x + B y = C ,

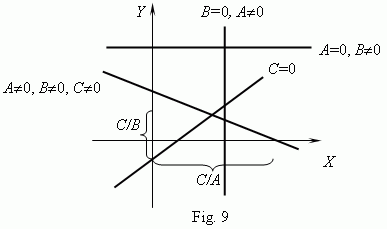
( at least one of numbers A or B is non-zero ), then a graph of the functional dependence is a straight line. If C = 0, then it goes through an origin of coordinates, otherwise - not.Graphs of linear functions for different combinations of   A, B, C are represented on Fig.9.

3.Inverse proportionality. If variables y and are inverse proportional, then the functionaldependence between them is represented by the equation:


  = k / x ,

where  k  is a constant.

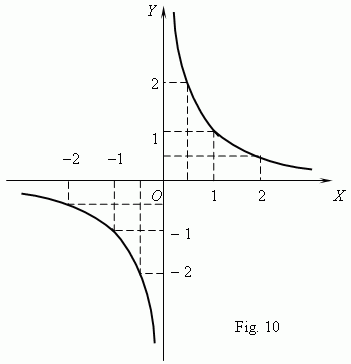
A graph of an inverse proportionality is a curve, having two branches ( Fig.10 ). This curveis called a hyperbola. These curves are received at crossing a circular cone by a plane(about conic sections see the paragraph "Cone" in the part "Stereometry (Solid geometry)").As shown on Fig.10, a product of coordinates of a hyperbola points is a constant value, equal in this case to 1. In general case this value is  , as it follows from a hyperbola equation:


x y = k.


The main characteristics and properties of hyperbola:
   -  the function domain:   x  0,  and codomain:  y  0 ;
   -  the function is monotone ( decreasing) at  x < 0 and at x > 0but it is not monotone on
       the whole, because of a point of discontinuity x = 0 (think, please, why ? );
   -  the function is unbounded, discontinuous at a point  x = 0, odd, non-periodic;
   -  there are no zeros of the function.
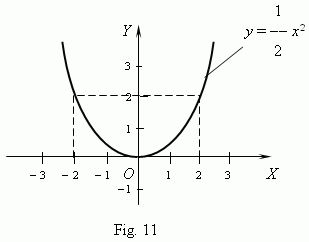
4.Quadratic function.  This is the function:  y = ax 2 + bx + c,  where a, b, c – constants,  a  0. In the simplest case we have  = c = 0 and  y = ax 2. A graph of this function is aquadratic parabola - a curve, going through an origin of coordinates ( Fig.11 ). Every parabola has an axis of symmetry OY, which is called an axis of parabola. The point of intersection of a parabola with its axis is a vertex of parabola.


A graph of the function y = ax 2 + bx + c is also a quadratic parabola of the same shape, that y = ax 2, but its vertex is not an origin of coordinates, this is a point with coordinates:


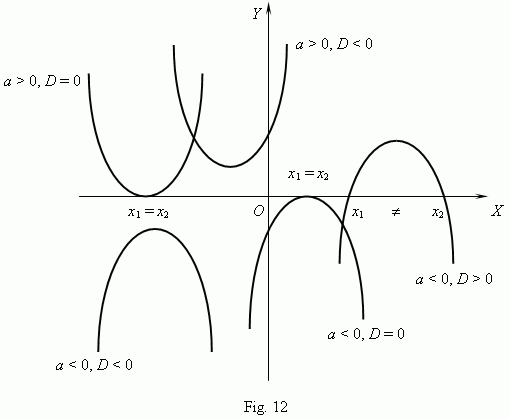
The form and location of a quadratic parabola in a coordinate system depends completely on two parameters: the coefficient a of x2 and discriminant D = b– 4ac. These properties follow from analysis of the quadratic equation roots ( see the corresponding paragraph in the part "Algebra").
All possible different cases for a quadratic parabola are shown on Fig.12.

Show, please, a quadratic parabola for the case a > 0, D > 0 .
The main characteristics and properties of a quadratic parabola:
  -  the function domain:  < x < +  ( i.e.  is any real number ) and codomain: … 
      ( answer, please, this question yourself  !) ;
  -   the function is not monotone on the whole, but to the right or to the left of the vertex it
      behaves as a monotone function;
  -  the function is unbounded, continuous in everywhere, even at  b = c = 0, and non-periodic;
  -  the function has no zeros at  < 0. ( What about this at  D 0 ? ) .
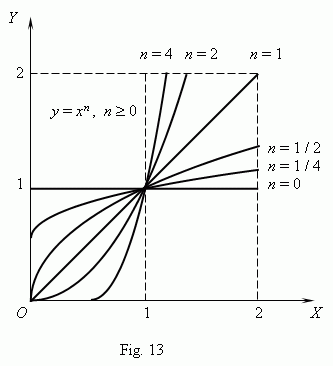
5.Power function. This is the function:  y = axwhere a, n – constants. At  n = 1 we receive the function, called a direct proportionality:  y = ax ; at  n = 2  - a quadratic parabola; at   n = – 1  -  an inverse proportionality or hyperbola. So, these  functions are particular casesof a power function. We know,  that a zero power of every non-zero number is 1, thus at  n = 0 the power function becomes a constant: y = a , i.e. its graph is a straight line, parallelto an  x-axis, except an origin of coordinates ( explain, please, why ? ).All these cases (at  a = 1 ) are shown on Fig.13 ( n 0 ) and  Fig.14 ( n < 0 ) .Negative values of   are not considered here, because then some of functions:


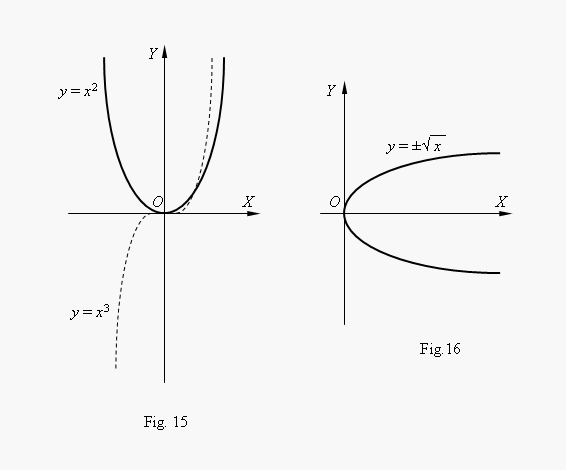
If   n – integer, power functions have a meaning also at < 0, but their graphs have different forms depending on that is  n  an even or an odd number. On Fig.15 two such power functions are shown: for  n = 2 and  n = 3.


At  n = 2  the function is even and its graph is symmetric relatively an axis ; at   n = 3 the function is odd and its graph is symmetric relatively an origin of coordinates. The function y = x3 is called a cubic parabola.

On Fig.16 the function  is represented. This function is inverse to the quadratic parabola y = 2, its graph is received by rotating the quadratic parabola graph around abisector of  the 1-st coordinate angle. (This is the way to receive a graph of every inverse function from its original function). We see by the graph, that this is the two-valued function(the sign ± before the square root symbol says about this). Such functions are not studied in an elementary mathematics, therefore we consider usually as a function one of its branches: either an upper or a lower branch.
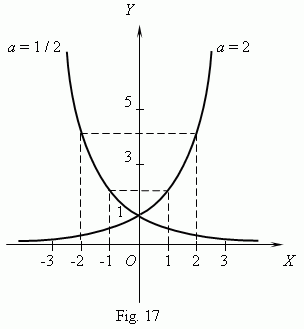
6.Exponential function. The function y = ax, where a is a positive constant number, is called an exponential function.  The argument x adopts any real values; as the function valuesonly positive numbers are considered, because otherwise we'll have a multi-valued function. So, the function y = 81 x has at x = 1/4 four different values: y = 3, y = – 3, y = 3and y = – 3i ( check this, please ! ). But we consider as the function value only   y = 3. Graphs of an exponential function for  a = 2  and    a = 1 / 2 are shown on Fig.17. All they are goingthrough the point  ( 0, 1 ). At   a = 1 we have as a graph a straight line, parallel to x-axis,i.e. the function becomes a constant value, equal to 1. At  a > 1 an exponential function increases, and at  0 < a < 1 – decreases.


The main characteristics and properties of a exponential function:
  - the function domain: –  < x < +  ( i.e. x is any real number ) and its codomain: y > 0;
  - this is a monotone function: it increases at  a > 1 and decreases at 0 < a < 1;
  - the function is unbounded, continuous in everywhere, non-periodic;
  - the function has no zeros.
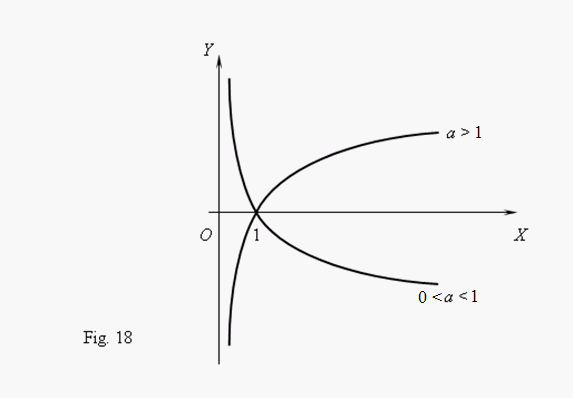
7.Logarithmic function. The function   y = log a x, where a is a positive constant number,not equal to 1, is called a   logarithmic function. This is an inverse function relatively to anexponential function; its graph  ( Fig.18 )  can be received by rotating a graph of an exponential function around of a bisector of the 1-st coordinate angle.


   The main characteristics and properties of a logarithmic function:
   -  the function domain: x > 0 and its codomain:    < y < +  ( i.e. is any real number );
   -  this is a monotone function: it increases at  a > 1 and decreases at 0 <a < 1;
   -  the function is unbounded, continuous in everywhere, non-periodic;
   -  the function has one zero:   x = 1.
8.Trigonometric functions. Building trigonometric functions we use radian as a measure of angles. Then the function  y = sin x is represented by the graph ( Fig.19 ). This curve iscalled a sinusoid.


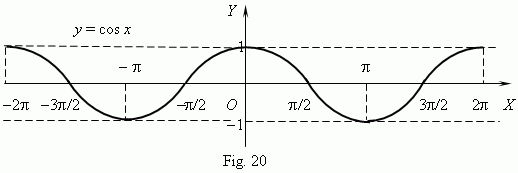
   The graph of the function  y = cos x  is represented on  Fig.20 ; this is also a sinusoid,
   received from the graph of  y = sin x  by its moving along an x-axis to the left for  / 2.


   From these graphs the following main characteristics and properties of the functions are obvious:
   - the functions have as a domain: –  < < +  and a codomain:  – 1  y  +1;
   - these are periodic functions: their period is  2  ;
   - the functions are bounded ( y | 1 ), continuous in everywhere; they are not monotone
     functions, but there areso called  intervals of monotony,inside of whichthey behave as
     monotone functions ( see graphs Fig.19 and Fig.20);
   - the functions havean innumerable set of zeros( see in details the section "Trigonometric equations" ).
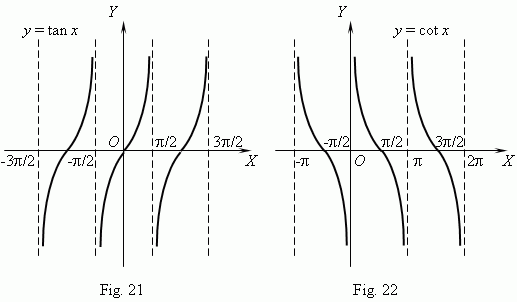
Graphs of functions  y = tan x and  y = cot x are shown on Fig. 21 and Fig. 22 correspondingly.

The graphs show, that these functions are: periodic (their period is ), unbounded, not monotone on the whole, but they have the intervals of monotony (what intervals ?), discontinuous functions (what points of discontinuity these functions have ?). The domain and codomain of these functions:


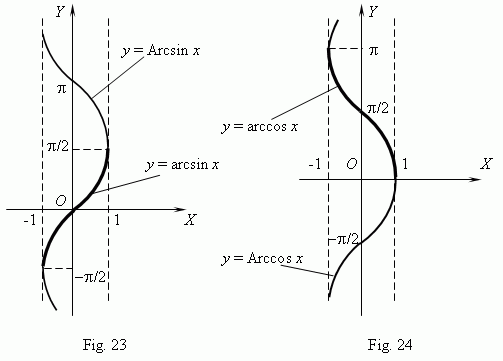
9.Inverse trigonometric functions. Definitions of inverse trigonometric functions and their main properties have been written in the same named paragraph in the section "Trigonometry".So, we’ll give here only short comments concerning their graphs receivedby rotating the graphs of trigonometric functions around a bisector of the 1-st coordinate angle.


The functions y = Arcsin x ( Fig. 23 ) and = Arccos ( Fig. 24 ) are multivalued, unbounded functions; their domain and codomain are correspondingly:  –1  x +1 and –  < < + . Because of they are multi-valued functions, not considered in an elementary mathematics, their principal values = arcsin   and  = arccos are considered as inverse trigonometric functions; their graphs have been distinguished on  Fig. 23  and Fig. 24  as bold lines.
The functions = arcsin x and = arccos have the following characteristics and properties:
- the both functions have the same domain: –1   x  +1;  their codomains are:
   –  / 2    y   / 2  for  = arcsin x and  0   y    for  y = arccos ;
- they are bounded, non-periodic, continuous and monotone functions ( y = arcsin is an
   increasing function;  y = arccos x – a decreasing function) ;
- each of the functions has one zero (= 0 of  y = arcsin x= 1 of  = arccosx).


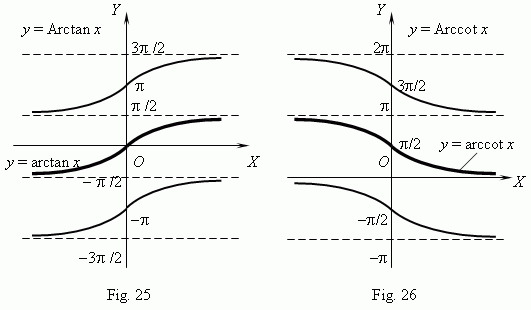
The functions y = Arctan ( Fig.25 ) and  = Arccot ( Fig.26 ) are multivalued, unbounded functions;  their domain is the same:   –   x + . Their principal values = arctan and  y= arccot are considered as inverse trigonometric functions; their graphs have been distinguished on Fig.25 and Fig.26 as bold branches.
The functions = arctan x and = arccot have the following characteristics and properties:
- the both functions have the same domain: –   x + ; their codomains are:
   –  / 2 < y <  / 2  for  = arctan x   and  0 < y <   for  = arccos ;
- they are bounded, non-periodic, continuous and monotone functions ( y = arctan is an increasing function,  y = arccot x   is a decreasing function) ;
- only  y = arctan  has one zero ( = 0 );   = arccot  has no zeros.